
 Philippines
 Vietnam
 Bali, Indonesia
 Malaysia
 Dubai, UAE
 India
India
The heaviest homepage in our sample, e-tesda.gov.ph, downloaded 95.6 MB on a simulated mobile connection. One slider image accounted for 75.9 MB of that. We tested government homepages from Singapore, Malaysia, Indonesia, Thailand, Vietnam and the Philippines with Lighthouse, three runs each, from a single test machine in India.
Does any government homepage in Southeast Asia pass the LCP threshold?
No. The lowest Largest Contentful Paint (LCP) in the sample was 2,740 ms, on the Thai government procurement portal gprocurement.go.th, and that page was a commemorative landing page rather than the full portal. Google's web.dev guidance on LCP sets "good" at 2.5 seconds or less.
The median LCP across all measured homepages was 15.8 seconds. The middle half of homepages ranged from 8.0 to 22.9 seconds.
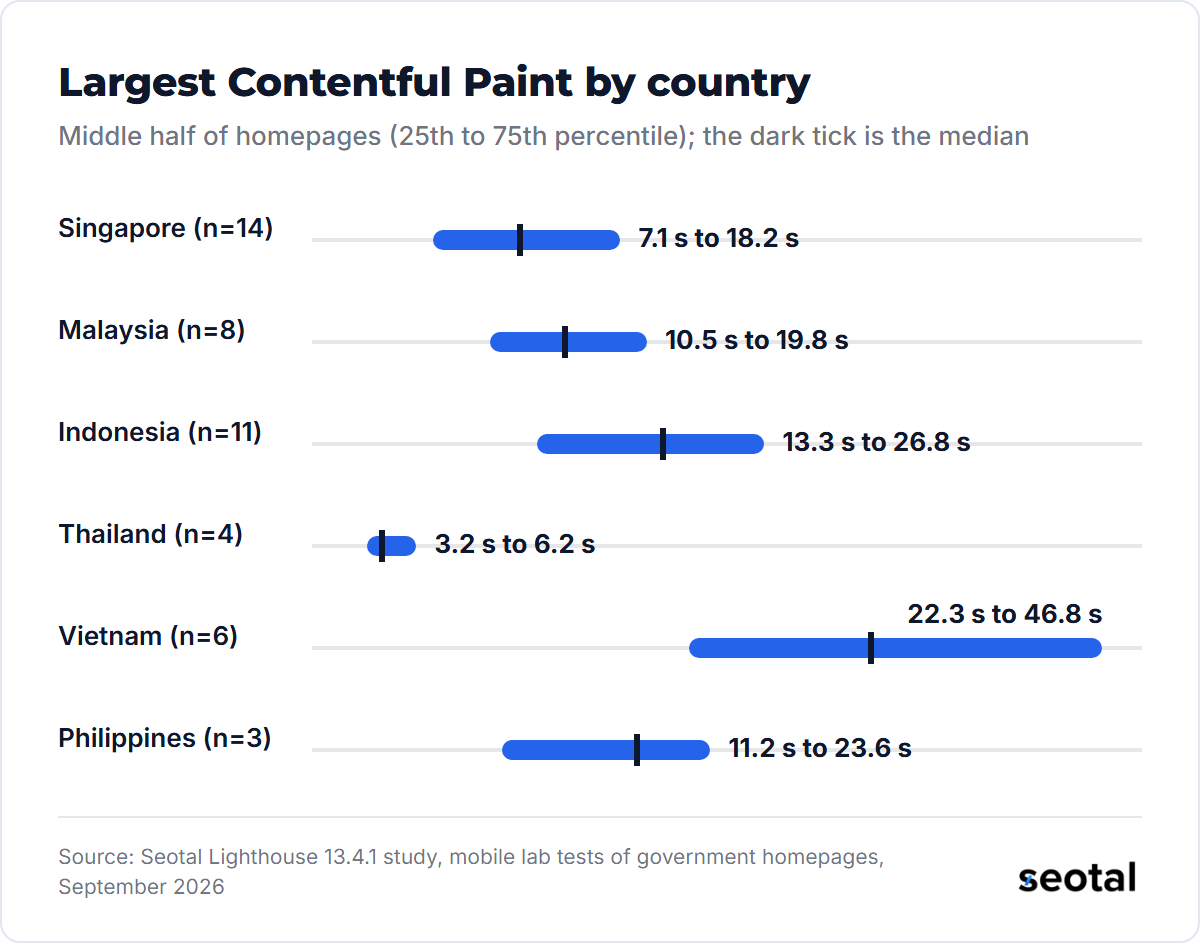
Vietnam had the widest spread. Its six measured homepages had a median LCP of 33.1 seconds, and the Vietnam Social Security site baohiemxahoi.gov.vn took 117.0 seconds in the median run. That homepage transferred 37.3 MB, of which 35.1 MB were images.
Thailand's short bars need a caveat. All four Thai homepages we measured showed a black and white commemorative landing page or overlay during the test window, so their numbers describe those pages, not the usual homepage behind them.
Which country's government homepages score highest?
Thailand's four measured homepages had the highest median Lighthouse performance score, 74, for the landing page reason above. Among countries with more than five measured homepages, Indonesia's 11 had the highest median, 36.
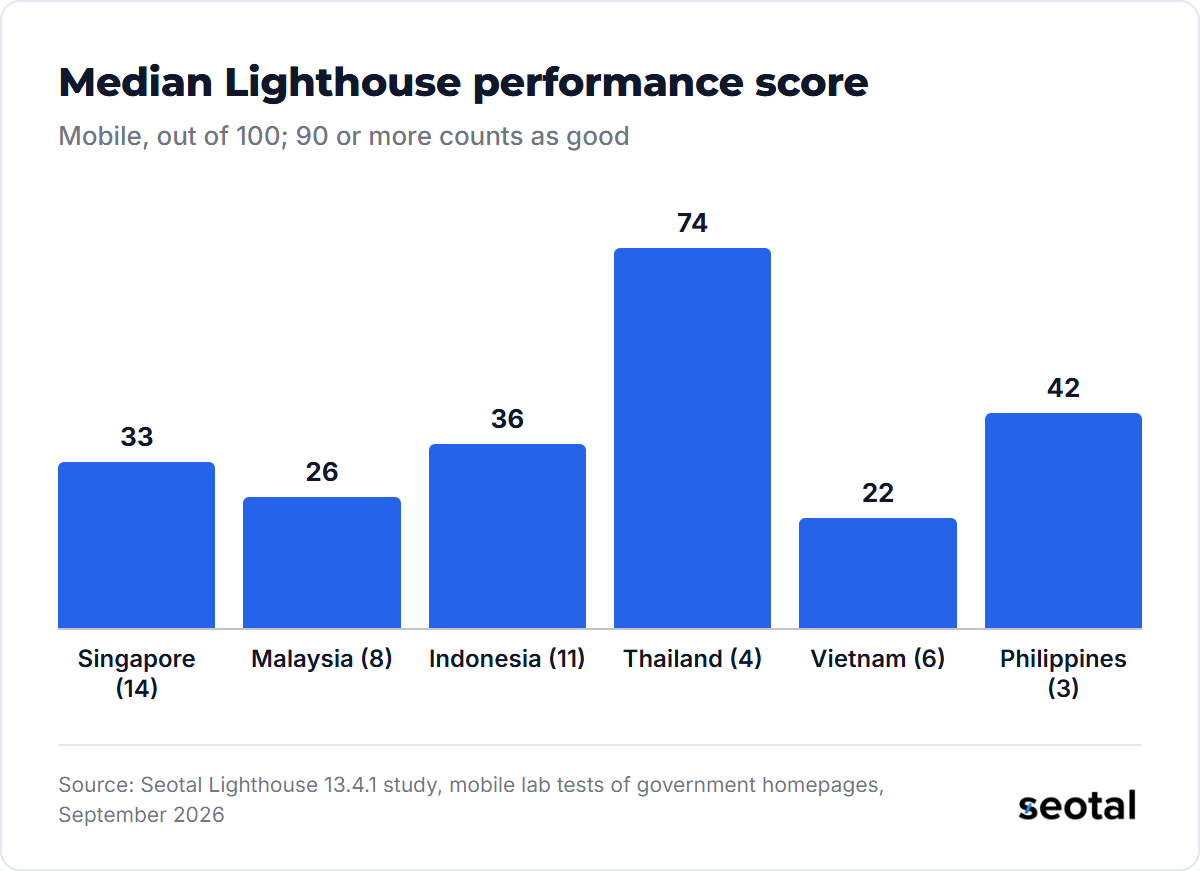
The country medians rest on 3 to 14 homepages each, so a single site moves them. Treat them as a description of the homepages we measured, not a ranking of national governments.
Lighthouse's scoring documentation weights Total Blocking Time at 30%, LCP and Cumulative Layout Shift at 25% each, and First Contentful Paint and Speed Index at 10% each. It labels 0 to 49 poor, 50 to 89 as needing improvement and 90 to 100 good.
- Poor (0 to 49): 37 homepages.
- Needs improvement (50 to 89): 8 homepages.
- Good (90 to 100): 1 homepage, the Thai procurement landing page.
How heavy are government homepages?
The median measured homepage transferred 5.6 MB across a median of 93.5 requests, and 24 homepages went over 5 MB. For comparison, the HTTP Archive's Web Almanac 2025 page weight chapter puts the median mobile home page at 2.6 MB in its July 2025 crawl. That crawl used a different tool, sample and location, so the two figures describe different populations.
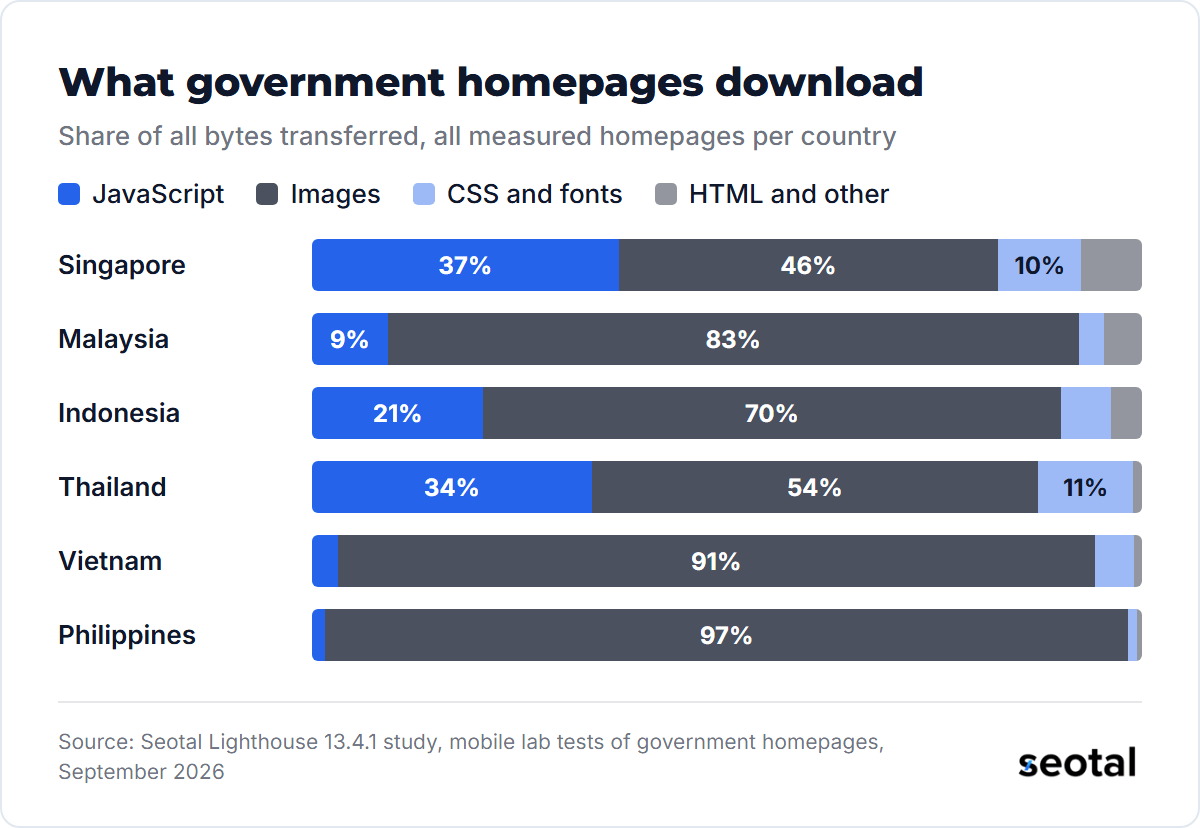
Images dominate the bytes in five of the six countries.
The largest single files were banners and sliders:
- e-tesda.gov.ph: a slider GIF of 75.9 MB, inside a 95.6 MB homepage that still scored 42.
- cantho.gov.vn: 33.8 MB in total, led by a 7.6 MB PNG banner.
- rtm.gov.my: 25.2 MB, with two animated GIFs of 9.5 MB and 6.9 MB loading as images.
- moe.gov.my: 22.4 MB, including a 3.5 MB PNG slider banner, and an LCP of 62.7 seconds.
A 9 MB GIF used as a moving banner is a strong candidate for conversion to a compressed video or a static WebP. Lighthouse counts it as an image, so it lands in the image share above.
Why do Singapore's government homepages carry more JavaScript?
JavaScript made up 36.9% of the bytes on Singapore's 14 measured homepages, against 3.1% in Vietnam and 1.6% in the Philippines. The median Singapore homepage downloaded 1.7 MB of script, and third-party requests accounted for 32.9% of its bytes.
That script shows up in blocking time. Singapore's median Total Blocking Time (TBT) was 931 ms, and only 1 of its 14 homepages stayed at 200 ms or less. 12 of the 14 Singapore homepages request files from WOGAA, the Singapore government analytics service.
Six Singapore homepages still went over 5 MB, so the JavaScript share rose alongside heavy images rather than replacing them. The Ministry of Health (moh.gov.sg) had the highest Singapore score, 65, with an LCP of 4.7 seconds and 3.2 MB transferred.
A homepage has 0 ms of Total Blocking Time and a 3.3 second LCP. Does it meet Google's "good" LCP threshold?
How many homepages meet each lab target?
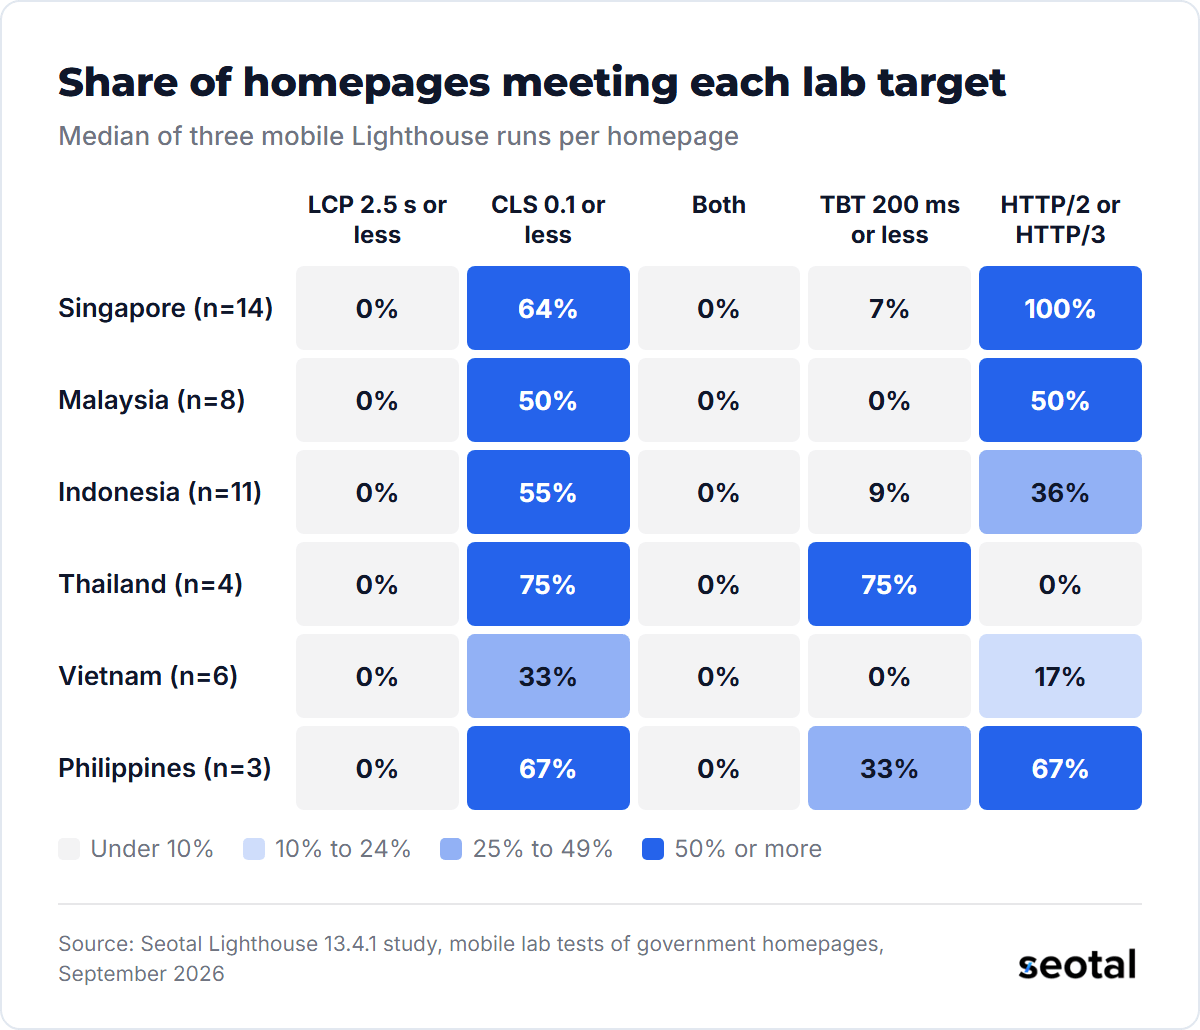
26 of the 46 measured homepages, 56.5%, kept Cumulative Layout Shift (CLS) at 0.1 or less, the "good" line in web.dev's CLS guidance. No homepage met both the LCP and CLS thresholds, because none met LCP.
The largest layout shifts in the sample:
- atrbpn.go.id (Indonesia's land agency) measured a CLS of 1.013, ten times the good threshold.
- baohiemxahoi.gov.vn measured 0.809.
- kemkes.go.id (Indonesia's health ministry) measured 0.439 and had the lowest score in the sample, 7.
Every measured homepage ended on an HTTPS URL. Protocol support split close to half and half: 25 served the main document over HTTP/2 and 21 over HTTP/1.1. None of the four Thai landing pages used HTTP/2, and neither did 5 of the 6 Vietnamese homepages.
Which government homepages were fastest and slowest?
The spread inside each country was wider than the gap between countries. Indonesia's homepages ran from 7 to 61, and the Philippines' from 25 to 85.
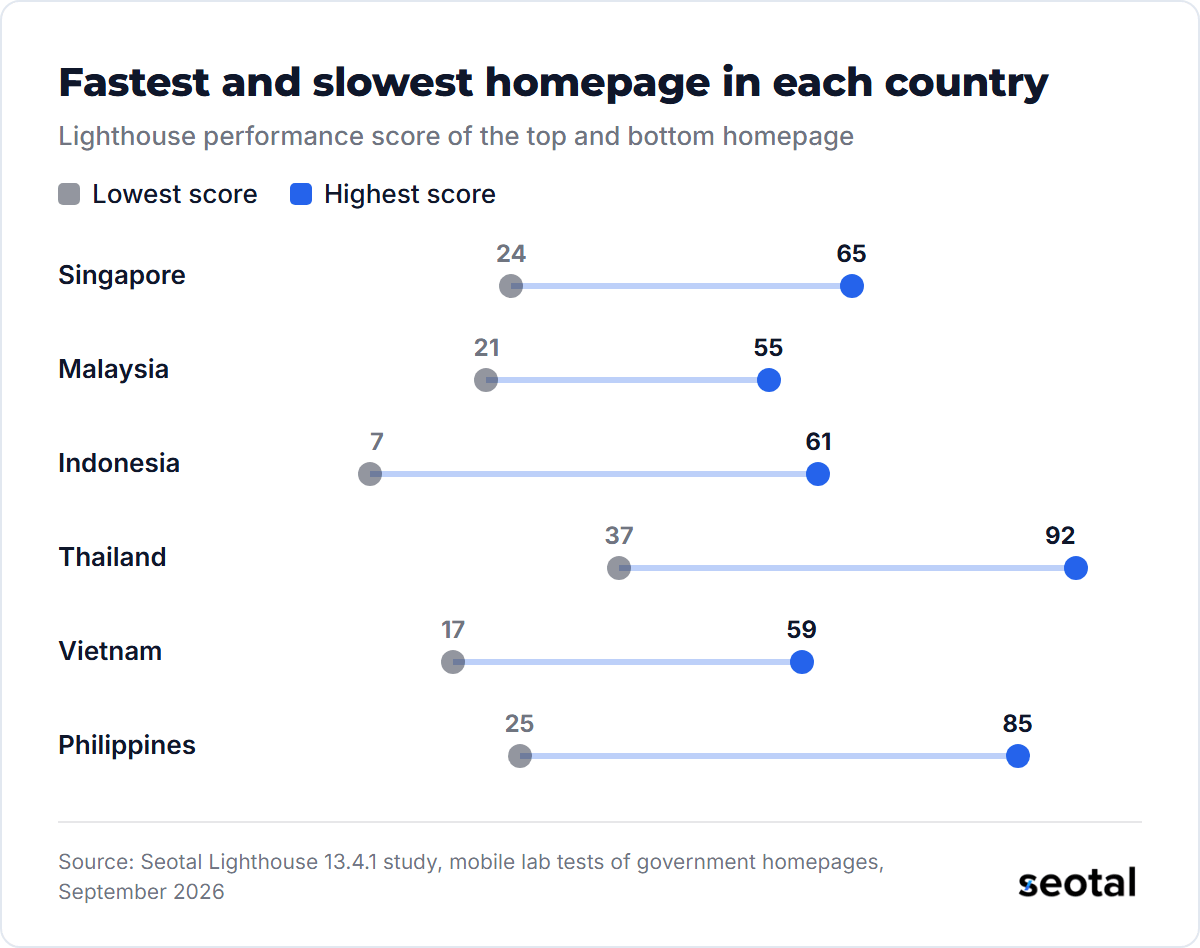
The higher scorers share small pages rather than a common platform:
| Homepage | Country | Score | LCP | Transferred | Requests |
|---|---|---|---|---|---|
| gprocurement.go.th (landing page) | Thailand | 92 | 2.7 s | 333 KB | 3 |
| passport.gov.ph | Philippines | 85 | 3.3 s | 836 KB | 11 |
| sso.go.th (landing page) | Thailand | 84 | 3.4 s | 220 KB | 6 |
| moh.gov.sg | Singapore | 65 | 4.7 s | 3.2 MB | 67 |
| agc.gov.sg | Singapore | 64 | 6.0 s | 716 KB | 47 |
| kemkes.go.id | Indonesia | 7 | 20.8 s | 13.9 MB | 331 |
The Philippine passport appointment site (passport.gov.ph) is the clearest non-landing example: a menu of four service links, jQuery and Bootstrap, 11 requests and 0.8 MB. At the other end, kemkes.go.id downloaded 9.8 MB of images and 3.1 MB of JavaScript, with 2,352 ms of blocking time.
How many government sites could not be tested?
We attempted 75 homepages and measured 46. The other 29 ended in a refusal, a connection failure or a page that was not the homepage.
| Country | Sampled | Attempted | Measured | Refused or server error | Did not load | Block or challenge page | Timed out or incomplete |
|---|---|---|---|---|---|---|---|
| Singapore | 40 | 15 | 14 | 1 | 0 | 0 | 0 |
| Malaysia | 40 | 10 | 8 | 0 | 0 | 0 | 2 |
| Indonesia | 40 | 15 | 11 | 1 | 3 | 0 | 0 |
| Thailand | 40 | 10 | 4 | 3 | 1 | 1 | 1 |
| Vietnam | 40 | 15 | 6 | 0 | 8 | 1 | 0 |
| Philippines | 40 | 10 | 3 | 4 | 0 | 2 | 1 |
Vietnam lost the most: 8 of its 15 attempted homepages, including hanoi.gov.vn and dichvucong.gov.vn, did not answer or did not load from our machine in India. Some of these failures are likely location based, and a test from inside each country could reach them.
Two homepages returned a firewall notice with the page instead of the site, and we moved them out of the results after reading the screenshots. One Singapore refusal followed the user agent: hdb.gov.sg returned HTTP 403 to a request carrying the Chrome-Lighthouse token and HTTP 200 without it. We did not change the user agent to get past it.
Methodology
Sample. We took the government domains (registry suffixes gov, go, mil and mi) from the published sample of our robots.txt study of Southeast Asian domains, which comes from Tranco list 46VQX, and kept the top 40 per country by Tranco rank: 240 domains. We tested them in rank order, cycling through the six countries. The study stopped after 75 attempts, so the 165 lower-ranked domains were not tested, and every figure here covers the 46 homepages we measured: Singapore 14, Malaysia 8, Indonesia 11, Thailand 4, Vietnam 6 and the Philippines 3.
Tool. Lighthouse 13.4.1 from npm, driving headless Google Chrome 152.0.7977.84 on Node.js 22.18, performance category only. We kept Lighthouse's default mobile emulation (a moto g power 2022 profile) and simulated throttling, which models a 150 ms round trip time and 1.6 Mbps throughput. Each homepage URL, https://domain/ with www or http as fallbacks when it did not answer, got three runs, and we report the median run by performance score.
CPU calibration. Our test machine is a 4-thread laptop CPU shared with other jobs, and Lighthouse flagged it as slower than it expects. Its throttling documentation recommends calibrating the CPU slowdown from each report's benchmarkIndex, so we applied the formula from Lighthouse's CPU throttling calculator to every run. The median benchmarkIndex was 761 and the median multiplier 1.94x. I judged that closer to a phone than the default 4x on this hardware, and we recorded both.
- 34 across 46 homepages
- Multiplier from each run's benchmarkIndex
- 27 across 46 homepages
- Fixed 4x for every run
Identification. Lighthouse 13's default mobile user agent does not include the Chrome-Lighthouse token, so we appended it, as PageSpeed Insights does, and changed nothing else. We did not retry blocked sites with another identity or try to pass bot checks.
Dates and location. Runs took place on September 13, 2026, between 17:04 and 19:34 UTC, from a machine in India (Cloudflare's Mumbai edge served our connection). Thresholds are Google's: LCP of 2.5 seconds or less and CLS of 0.1 or less, both from web.dev. TBT is scored against 200 ms as a lab marker only.
Variance. Across the three runs per homepage, the median gap between the highest and lowest score was 9.5 points (25 points at the 90th percentile), and LCP varied by a median of 19.3%. We re-ran three homepages once, about 2.5 hours after their first test, against a tolerance of 10 points and 20% LCP:
- agc.gov.sg: 64 to 57, LCP 12% lower. Within tolerance.
- gprocurement.go.th: 92 to 97, LCP 31% lower, and the page transferred 89 KB instead of 333 KB. The page itself changed.
- moh.gov.sg: 65 to 50, LCP 11% higher. Outside the score tolerance.
Limitations.
- Lab, not field. These are Lighthouse lab results, not field Core Web Vitals. We did not use Chrome UX Report data: the CrUX API requires a Google Cloud API key, and we did not use a key or BigQuery for this study.
- One location. Server response times and reachability from India differ from those inside each country, and 12 homepages did not load from there.
- Homepage only. Service pages, forms and search results can be faster or slower than the homepage.
- Small country samples. Three to 14 measured homepages per country cannot rank national governments, and Thailand's four were landing pages.
- Simulated throttling and variance. Lantern estimates metrics from one unthrottled load, and scores moved up to 15 points on re-test.
- Sites change. Banners, landing pages and firewalls change week to week.
The per-homepage results, including excluded and untested domains, are in government-website-speed-southeast-asia.csv, and the totals are in the summary JSON.
Get a technical SEO or website manager specialist through Seotal
Oversized sliders, HTTP/1.1 servers and late-loading banners are fixable without a rebuild, and they are the first things a technical SEO audit or a website manager picks up. Seotal matches you with vetted freelance specialists, including technical SEO experts who work on Core Web Vitals optimization and JavaScript SEO. See the technical SEO experts to hire, SEO and AEO principles for front-end developers and Nuxt.js vs Next.js vs Astro for SEO.
You get 3 to 5 vetted profiles within 72 hours of your brief. Hourly work costs $15 to $30 with no minimum, and a part-time retainer costs $1,000 to $2,000 a month for 60 to 80 hours, with a 3-month minimum and a 30-day replacement guarantee (see pricing). Hire an SEO expert or hire a website manager. For connection speeds on the user side, see internet speeds for remote work in Asia, and for markup, our structured data adoption study.
Government website speed: frequently asked questions
Is a Lighthouse score the same as Core Web Vitals?
No. Core Web Vitals are measured from real Chrome users at the 75th percentile of page loads, while a Lighthouse score comes from one simulated load. A page can pass in the field and score poorly in the lab, or the reverse.
Can I reproduce these results?
Yes, with variance. The scripts, sample and CSV are published, and a run of Lighthouse 13.4.1 with the same settings on a different machine, location or day will return different numbers, as our re-test showed.

 How Many Websites Targeting Southeast Asia Get hreflang Wrong? (2026 Study)
  Structured Data on Southeast Asia's Top Websites: A Schema Markup Study (2026)
 ![How to Hire an SEO Specialist from Asia [2026]](/assets/blog/how-to-hire-an-seo-specialists-cover.png) How to Hire an SEO Specialist from Asia [2026]
How to Hire an SEO Specialist from Asia [2026]